Were southern soybean farmers at top of mind in the design of recent USDA tariff and disaster relief programs?
It is nosecret that the US agricultural sector has undergone a difficult past fewyears. Going into 2018 prices were low as part of the natural ebb and flow of acommodity cycle that is largely dictated by market fundamentals of petroleum aswell as the strength of the US dollar. While most seasoned farmers were equippedto weather this storm, none could have predicted and few would be prepared forwhat was to come.
In April of 2018, China, in response to tariffs levied by the Trump administration, identified a list of 106 different American products, including numerous agricultural products, that would be subjected to a 25% tariff. The tariff went from the abstract to the concrete in mid-June when China announced a July 6th implementation date, and the impact on US agricultural products was immediate. With many US agricultural products effectively barred from the world’s largest market, prices began to fall with the steepest declines reserved for those commodities that relied most heavily on the Chinese market – with soybeans being chief among them.
Over thecourse of June, US soybean futures lost over 15% of their value and the USDAneeded to act fast. Enter tariff aid and the Market Facilitation Program (MFP).
In this blogpost we explore the design of tariff aid and the MFP in both its 2018 and 2019incarnations as well as subsequently announced discretionary disaster relief. Wego on to offer some analysis as to whether these programs are purely objectivein their levels of support by commodity and geography or whether there weremore political considerations at play.
What we findis that for 2018/19, payment calculations by commodity were both transparentand objective in the level of support offered across commodities but that withthe advent of MFP 2.0, more political considerations crept in to play –seemingly with an eye on the needs of the flood-impacted Midwestern Farmer. Similarly,the design and timing of the Disaster Assistance Bill, signed in June, suggeststhat agricultural interests outside of the Farm Belt, can at times get pushedto the back burner.
Design of2018/19 and 19/20 tariff aid packages
On July 24th,2018, with prices for several key agricultural products in freefall, the USDAannounced $12 billion dollars in trade mitigation programs (tariff aid) – ultimatelylaunching those programs in early September. By far the largest of thesemitigation programs was the Market Facilitation Program (MFP) payments withsubsequent Congressional Research ServiceAnalysis estimatingthe cost of this provision exceeding $9.5 billion. Nine commodities wereeligible for MFP payments, five of which were row crops, two of which werelivestock products and two more being tree crops. The size of the MFP paymentmade to growers was designed to reflect the degree to which it’s marketing wasdisrupted by tariffs – a detailed explanation of the calculation can be found here.
Diagram 1,below, illustrates a simplification of that formula and illustrates that, thelarger the share of the commodity exported to countries that put tariffs inplace, the larger the level of MFP support. While some commodity organizationsultimately voiced dissatisfaction with the size of the payment awarded, thisdiagram shows that the payments, as allocated across commodities, were bothfair and objective. MFP payments were made on the basis of 2018 production,and for reasons we will get into when discussing payment mechanisms for the2019 iteration of the MFP program, showed a lack of consideration for certain states,North Carolina being chief among them, making MFP payments less fair acrossgeographies than they were across commodities.
Diagram 1: Relationship between 2018/19 MFP payments and share of product exported to China and Mexico

In addition to MFP payments, 2018/19 trade mitigation programs included a 1) Food Purchase and Distribution program and 2) an Agricultural Trade Promotion program. The Food Purchase program made purchases of $1.24 billion in 2018/19 with another $1.4 billion authorized under the 2019/20 package. Livestock products faired especially well under the Food Purchase provision, accounting for more than half of total purchases with the balance being made up with fruits, nuts and vegetables (Diagram 2). Row crops, like soybeans, received no support under this program.
TheAgricultural Trade Promotion Program, meanwhile, was funded to the tune of $200million dollars in 2018/19, with an additional $100 million granted under the2019 package. While soybeans, as a discrete commodity group, was the largestrecipient of these funds (Diagram 3), it was arguably underfunded relative toother row crops and livestock products if one were to use the same logicemployed in MFP calculations, namely the degree to which the commodity wasimpacted by trade disruption, as a guide.

In the wakeof USDA’s September 2018 implementation of tariff aid, US-Chinese trade negotiationswent through a period of retaliation, renewed threats and false starts towardreconciliation. In early May of 2019, US tariff rates on $200 billion of Chinesegoods increased from 10% to 25% with China hiking duties to 25% on $60 billionof US goods beginning June 1st. Throughout that time period, pricesfor the most impacted agricultural commodities, like soybeans, continued to falland with no trade agreement in sight, the USDA announced $16 billion towards asecond round of Trade Assistance on May 23rd.
Under the 2019/20 iteration of tariff assistance, mechanisms for food purchases and trade promotion were the same as 2018/19, even if the funding levels were slightly different as discussed above. However, the design of the component funneling aid directly to farmers, namely the MFP payment, was quite different. For 2019/20, in an effort not to skew planting decisions, the $14.5 billion in MFP funding would be based on a county-level rate rather than payments being tied to a specific commodity. This county-level rate would be applied across the acreage planted under all MFP eligible commodities to determine total trade assistance paid to an individual farmer. Critically, 2019/20 MFP assistance was tied to acreage planted, rather than production – a clear win for Midwestern farmers who will see a major reduction in yields stemming from historic flooding. In 2018/19, by contrast, with MFP payments tied to yields, North Carolina farmers reeling from the impacts of Hurricane Florence & Michael received no such consideration.
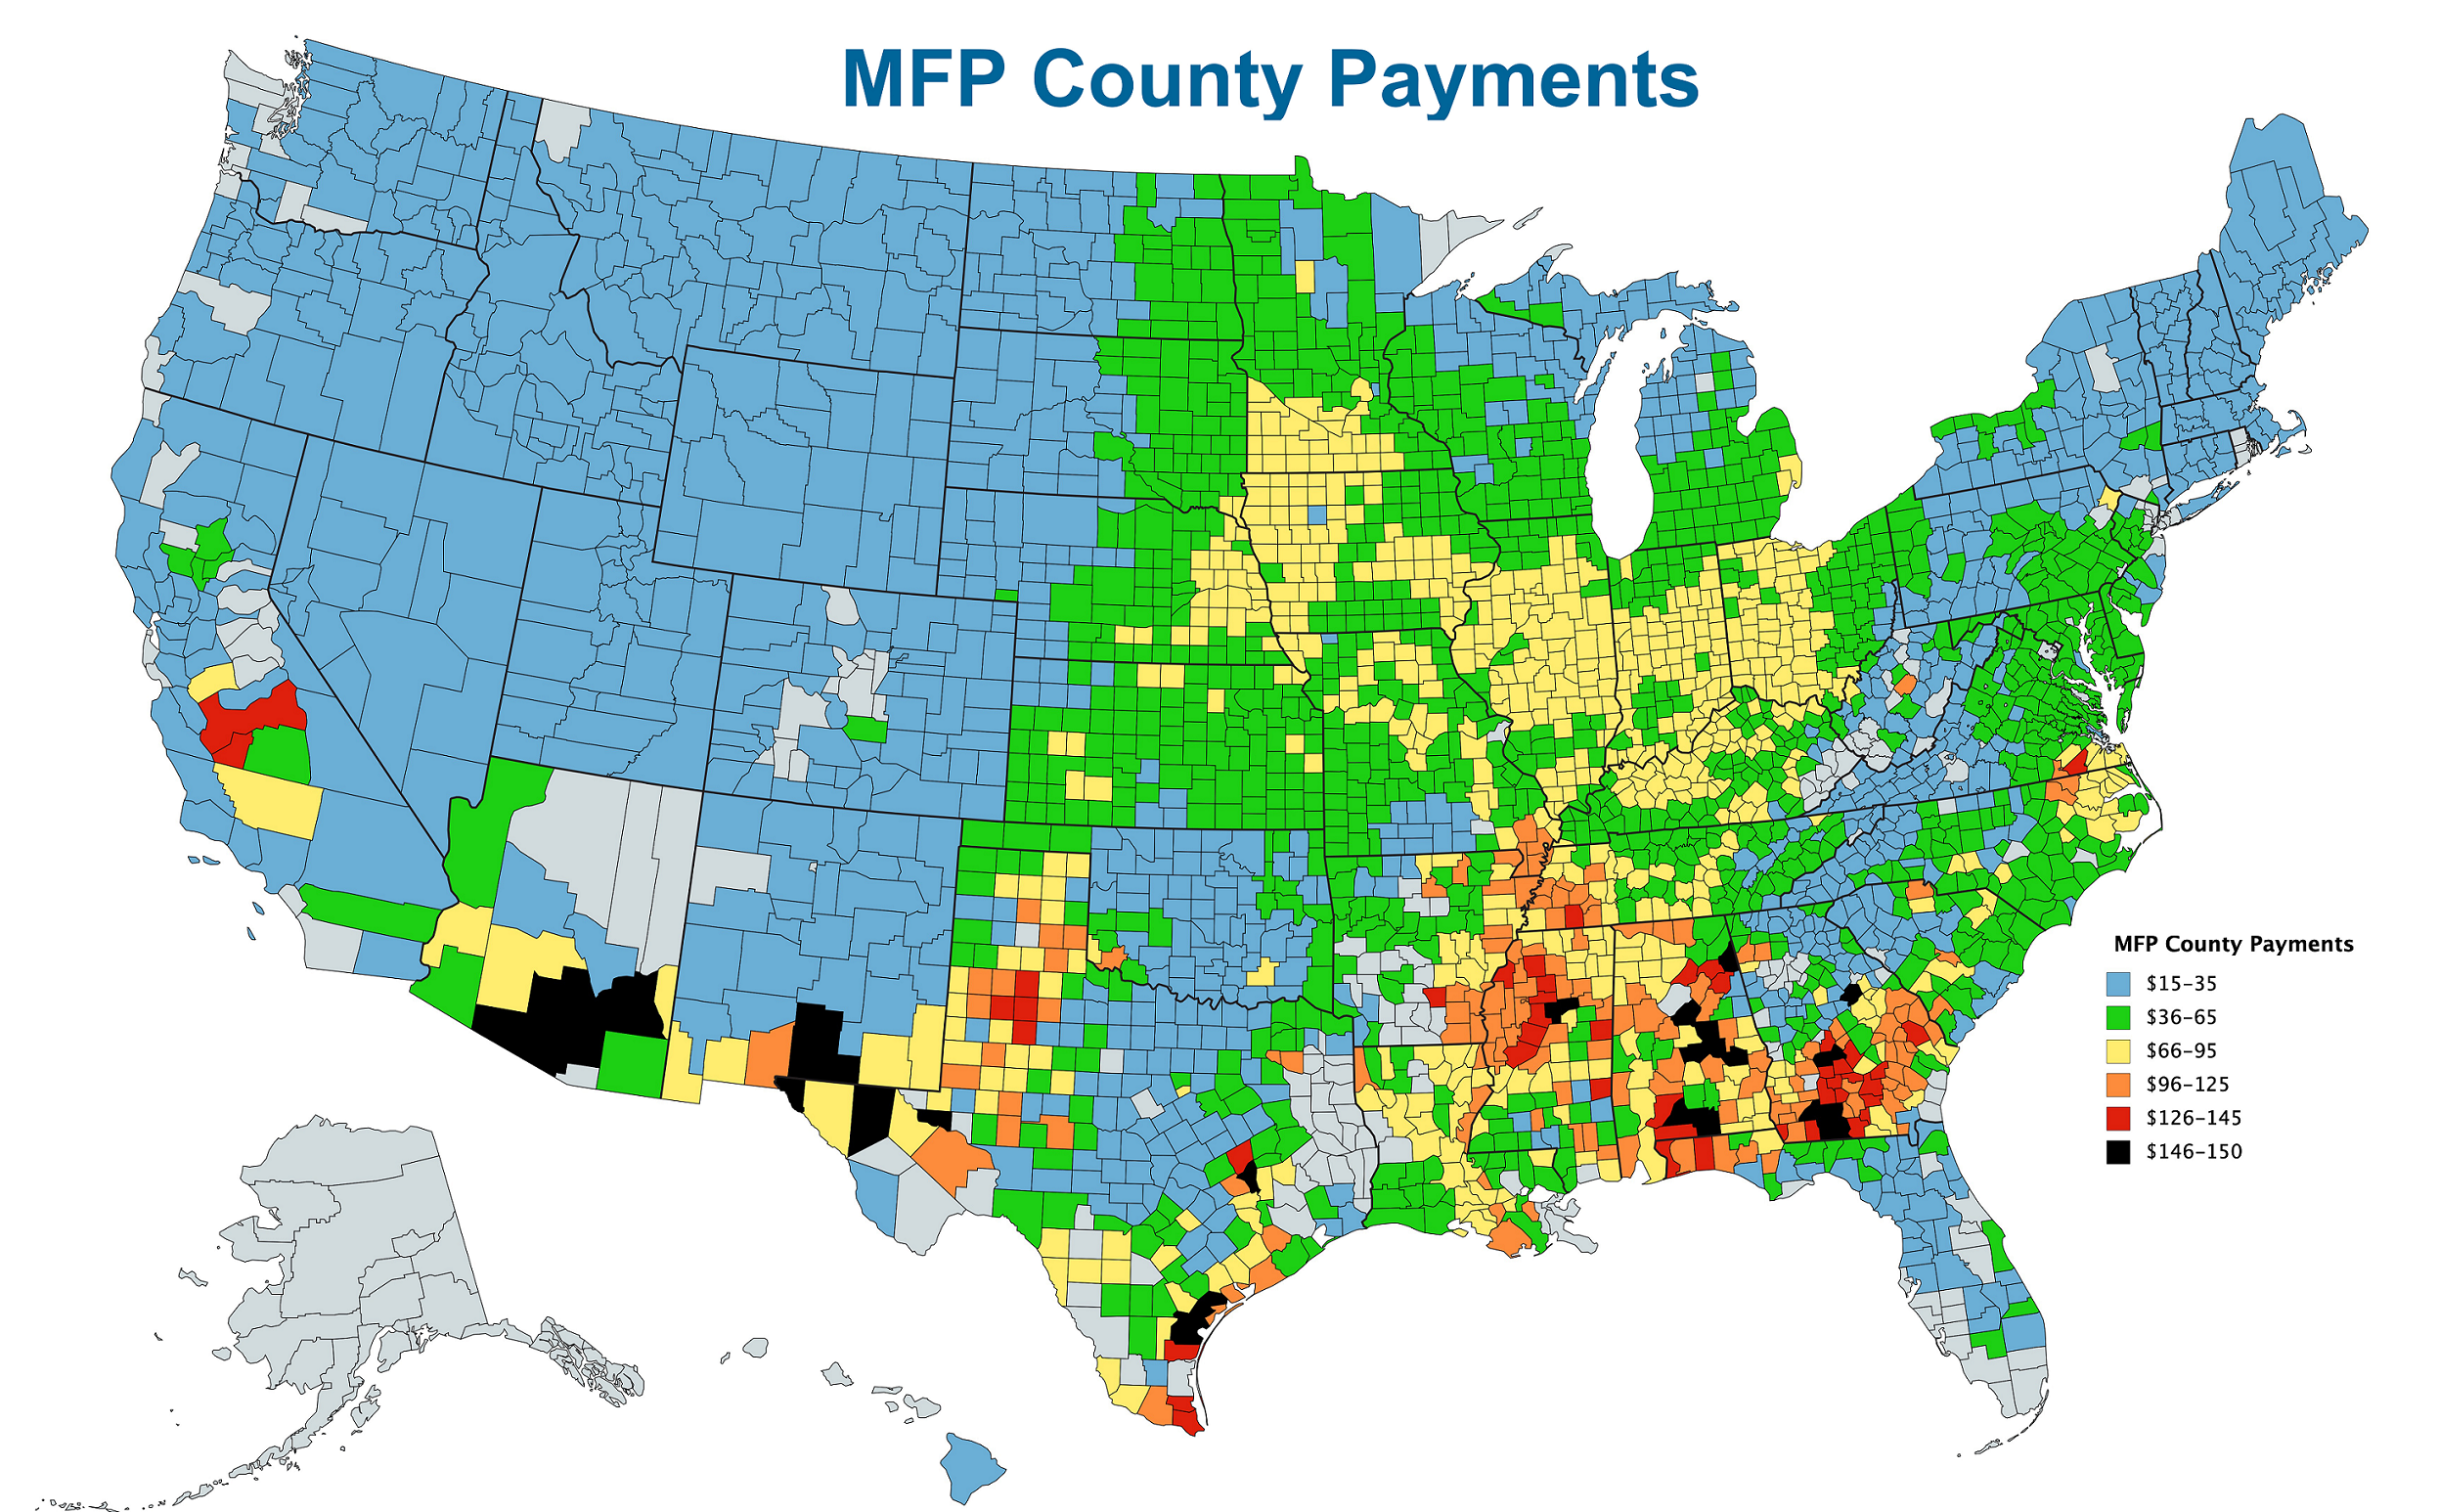
The USDA released the county-level MFP payment rates on July 25th (Diagram 4). While subsequent investigations by the agricultural community would find that payment rates were based on a function of 1) the 3-year average RMA yields for the county, 2) the 4-year average FSA planted acres for the county and 3) the damage rates for the covered crops, the Department has been fairly cagey in terms of releasing further details. For 2018/19 the Department released explicit damage rates and compensation values by commodity – something they have, so far, refused to do for 2019/20.
Diagram 4:MFP payment rates by county

Estimatingthe implied value of select commodities according to 2019/20 MFP payments
While theUSDA did not provide explicit compensation values by commodity, the shearnumber of county-level payments provided, coupled with ample yield and acreagedata for these counties, means that in the case of some commodities, impliedcompensation rates can be estimated statistically. Given the dominant positionof soy and corn in terms of acreages planted across the country, estimates ofimplied compensation values for these commodities are likely to be the mostrobust.
To estimatethese values, we began by selecting all US counties where more than 95% ofacres planted to MFP eligible crops were in corn and soybeans. Next, we foundthree-year average production and acreage values for corn and soy. A simplecalculation was performed to determine 1) corn production over corn + soy acresand 2) soy production over corn + soy acres. These values served as ourindependent variables and allow us to account for relative acres in corn andsoy, and yields. The MFP payment rate, meanwhile, is used as our dependentvariable. The scatterplot resulting from these three series is illustrated inDiagram 5 while the plane resulting fromthe ensuing regression is illustrated in Diagram 6.
Diagram 5: MFP rates compared to the relative share of corn and soy production per county

Diagram6: Implied MFP rates for corn and soybeans based on relative share of corn andsoy production per county

Afterobtaining coefficients for our two independent variables, we estimated theimplied MFP value of an acre of corn or soybeans by doing the following:
- To determine the MFP value of an acreof corn, we set the soy/(corn+soy acres) coefficient equal to zero and set the corn/(corn+soyacres) coefficient to 176 – the three year average US corn yield.
- To determine the MFP value of an acreof soy, we set the corn/(corn+soy acres) coefficient equal to zero and set thesoy/(corn+soy acres) coefficient to 51 – the three year average US soybeanyield.
Indoing so, we find that the value implied by 2019/20 MFP county rates is $0.30per bushel of corn and $1.52 per bushel of soybeans.
Table1: Implied value of corn and soybeans under 2019/20 MFP payments
| Implied MFP value based on 16-18 avg. yield ($/ac) |
Avg. MFP value ($/bu) | Marginal MFP value above $15/acre minimum ($/bu) |
Makret valuation of commod. based on 16-18 avg. yield & price ($/ac) | MFP as a share of market valuation | |
| Corn | 52.8 | 0.30 |
0.22 | 604.4 | 8.7% |
| Soy | 77.3 | 1.52 | 1.22 | 474.2 | 16.3% |
Is thevaluation of commodities implied by 2019/20 MFP rates purely a reflection ofthe damage they have incurred in the trade dispute or are politicalconsiderations at play?
As mentioned earlier in this post, 2018/19 payment rates by commodity were both transparent and purely objective in the sense that they were tied to the level of damage sustained by tariffs on US agricultural products. Under the 2018/19 iteration, MFP payment rates were $1.65/bu for soybeans and $0.01/bu for corn. A look at the implied valuation rates in Table 1 ($1.52/bu for soybeans, and $0.30/bu per corn) may lead one to assume that market conditions for soy have gotten better while growing worse for corn – something that is not supported by the data.

Diagram 7,for instance, reveals the extent to which prices for select commodities haveevolved since the Chinese first threatened tariff retaliation in April of 2018.Since then, soybean prices have registered the biggest declines, by far, downnearly 20% through May 2019. Corn prices, meanwhile, have been quite stable,falling slightly in the summer of 2018 but recovering since then. A look at therelative pricing of soybeans and corn over time does little to overturnthe idea that soybeans have been harmed far more than corn from the trade war.The ratio of corn/soybean prices was above the 2010-18 average last year andwell above the 2010-18 trend with more of the same projected for 2019/20(Diagram 8).
With marketdynamics unable to account for the seeming reversal of fortunes in MFPvaluations for corn and soy over the past year the appears to be politicalconsiderations at play. By increasing the MFP valuation for corn relativeto soy, the USDA will be able to spread MFP payments more evenly across largeswaths of Midwest – providing support to a broader share of a constituency thathas been hammered by low prices over the past few years.
Consulting the county-level payment map (Diagram 4) speaks to this broader distribution but also illustrates the degree to which the cotton and peanut belt in the southern tier benefitted from high rates. Revisiting Diagram 7, however, we observe that cotton prices, are actually up in the period that the trade war has been underway, suggesting that its current bout of low prices may be more rooted in preexisting market fundamentals than tariffs. Peanut prices, meanwhile, have fallen by over 10% during the observed time frame, but only a small portion of their export market has been impacted by tariffs. It is estimated, for example, that between the EU tariff on peanut butter and the Chinese ban on all peanut products, fewer than 100,000 tonnes of US exports on an annual basis, or less than 3% of US peanut production, were directly impacted by tariffs. Again, this suggests that market fundamentals (skewed by domestic policy), rather than the trade war may behind much of the decline in peanut prices.
Given the large payments conferred to peanut and cottoncounties, coupled with evidence suggesting the trade war’s impacts on thesecommodities was muted, these commodities appear to be the vessel by which MFPpayments were spread throughout the South, just as corn helped make paymentsmore even across the Midwest.
Timingand design of disaster relief payments
In the midst of the trade disputes that have arisen over the past 18 months American farmers have also had to contend with some abysmal weather. While weather problems began in the fall of 2018 with flooding brought on by Hurricane Florence in the Carolinas it is the historic flooding that hit the Midwest in the spring of 2019 that has received more attention.
On June 6thPresident Trump signed a $19.1 billion disaster aid bill – not a momenttoo soon for Midwestern farmers but a full nine months after Hurricane Florenceinundated the Carolinas. Included in the bill was $3.005 billiondollars worth of aid to farmers to help cover crop losses from disastersspanning the 2018 and 2019 crop years. Beyond specifying the $3 billion total,the bill offered few details on how the money would be allocated across thecountry, or how it would mesh with the $15 cover crop provision of MFP 2.0 –arguably a form of weather-related assistance in its own right.

The language of the billdid specify that money could be used to increase coverage of lossescaused by prevented plantings in 2019 to up to 90% of the insuranceguarantee or up to 70% for uninsured crops. Coverage up to the existingPrevent Planting Factors, which generally range from 50%-60%,would come from RMA funds as normal, but any bridge to the 90% level orcoverage on uninsured crops would come from the $3 billion of disasteraid available to farmers.
Diagram 9 illustrates the cost to the USDA for increasing prevented plant coverage by 10%, 20% and 30% over the Prevent Planting Factor as well as up the maximum of 90%. The diagram assumes 1) an 85% insurance coverage level across the board and 2) that 100% of acres are insured (closer to 90% in reality) and shows that costs could approach $2 billion dollars for 19/20 prevent plant Corn, Soybeans and Wheat if this option was fully exercised - leaving little left over for the effects of Florence felt in North Carolina.
Summaryand Conclusions
Farmers’first preference will always be to first, farm and then, to sell their crops onthe open market. In the last 18 months, however, we have seen these naturalinclinations of growers run up against some major roadblocks. The details ofthe first round of tariff assistance, announced in August of 2018, included MFPcalculations that were both transparent and objective in the level of supportthey provided commodities impacted by the trade war. Certain quirks of designin MFP 2.0, however, suggested that the 2019 iteration had more politicalconsiderations at play.
While notdelineated explicitly, through statistical analysis or simply by viewing a mapof county rates, it appears that a number of commodities were valued morehighly in the MFP 2.0 calculations than would have been warranted by looking attariffs’ impact on prices. Corn, for example, appears to have been used as amechanism by which to spread payments more evenly across the Midwest, while morepayments were channeled to the South using peanuts and cotton. Given the degreeto which soybean prices have been adversely impacted by Chinese tariffs, it, bycontrast, was not a big winner under the 19/20 MFP program. The fact that 19/20MFP payments were tied to planted acres, was a departure from the 18/19production-based approach that was clearly designed with the flooded-out Midwesternfarmer in mind. The North Carolina farmers impacted by Hurricane Florence in2018/19, meanwhile received no such consideration.
Lesserdiscussed tools under both the 2018/19 and 2019/20 tariff aid packages includedthe Trade Promotion Program, where soy did well in receiving $35 million of the$300 million spent over two years. This was a pittance, however, compared tothe $2.6 billion spent under the Food Purchase and Distribution Program, whichdirected aid to more consumer-facing products, few of which were impacted bytariffs to the same extent as soybeans.
Turning from the commodity specific support of the tariff assistance programs to whole farm support offered under USDA’s $3 billion in Disaster Assistance funding we are given reasons to believe that the latter was also not designed with the Southern farmer at top of mind. First, from a timing perspective, the Disaster Assistance bill was signed in early June, right on the heels of Midwestern Flooding, but a full nine months after flooding caused by Hurricane Florence. Additionally, from a program design perspective, the Disaster Assistance bill opens up the possibility that up to two-thirds of the money available could go to further compensate Midwestern farmers, leaving less for the 18/19 hurricane impacts felt in the Carolinas.
While the North Carolina grower is greatly appreciative of the assistance offered by USDA over the past 18 months - which has been critical to farm survival in some instances - we look forward to working more closely with the USDA in the future to make sure ad hoc agricultural policies are designed for farmers inside and outside the farm belt, alike.